.png)
Whether you're managing a school, care home, healthcare facility, commercial building or multi-site property portfolio, maintenance generates a huge amount of data every day. The challenge isn't collecting that data, it's knowing which metrics actually matter.
That's where facility maintenance KPIs (Key Performance Indicators) come in.
The right maintenance KPIs help facilities managers understand how effectively their maintenance operation is performing. They provide measurable insights into asset reliability, maintenance efficiency, technician productivity and overall operational performance, making it easier to reduce downtime, control maintenance costs and make informed decisions.
Rather than relying on assumptions, maintenance KPIs allow you to answer important questions such as:
Facility maintenance KPIs are measurable performance indicators used to evaluate the effectiveness of maintenance operations.
They allow facilities managers to monitor everything from preventive maintenance performance and work order completion to asset reliability and maintenance costs.
Unlike individual maintenance metrics, which measure specific activities such as the number of work orders completed or maintenance hours logged, KPIs combine multiple data points to provide a clearer picture of overall maintenance performance.
For example, the number of preventive maintenance tasks completed is a maintenance metric. When compared against the total number of scheduled preventive maintenance tasks, it becomes a KPI that measures Preventive Maintenance Compliance.
Tracking these indicators consistently helps organisations identify trends, benchmark performance and make informed decisions that improve the efficiency and reliability of their facilities.
In this guide, we'll explain the 12 facility maintenance KPIs every facilities manager should track, including how to calculate each one, why it matters, typical benchmarks and practical ways to improve maintenance performance.
Every maintenance team has the same objective: keeping buildings, equipment and assets operating safely, efficiently and cost-effectively.
Without meaningful reporting, however, it's difficult to know whether your maintenance strategy is actually achieving those goals.
Maintenance KPIs transform everyday maintenance activity into measurable insights. They help facilities managers understand what's working, identify areas for improvement and make better operational decisions based on data rather than instinct.
Monitoring the right KPIs can help your organisation:
The most effective maintenance teams don't simply complete more work. They focus on completing the right work, measuring the outcomes and continuously improving their maintenance strategy over time.
Before we explore each KPI in detail, here's a quick overview of the key maintenance metrics every facilities manager should be tracking.
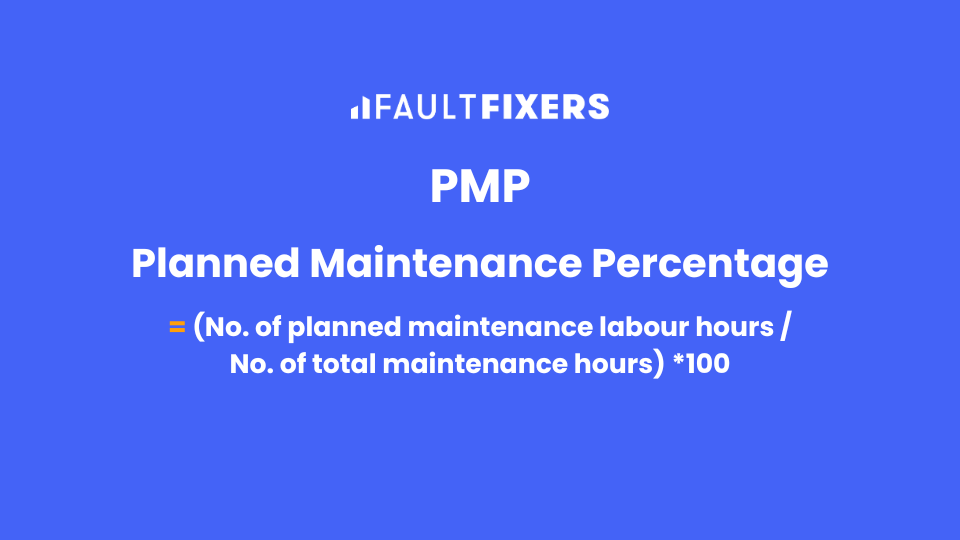
Planned Maintenance Percentage measures how much of your maintenance effort is planned rather than reactive.
Unlike emergency repairs, planned maintenance is scheduled in advance and designed to prevent failures before they occur.
A higher Planned Maintenance Percentage generally indicates a more proactive maintenance strategy.
(Planned Maintenance Labour Hours ÷ Total Maintenance Labour Hours) × 100
Some organisations calculate this using work order numbers rather than labour hours. While both approaches are useful, labour hours provide a more accurate reflection of maintenance effort.
Reactive maintenance is often significantly more expensive than planned maintenance. Emergency call-outs, operational disruption, overtime costs and unexpected equipment failures can quickly consume maintenance budgets.
A higher PMP usually results in:
Rather than constantly responding to failures, maintenance teams can focus on planned inspections, servicing and preventative work that reduces future disruptions.
Many high-performing maintenance teams aim for 70–90% planned maintenance, although the ideal balance varies depending on industry, asset criticality and operational requirements.
Healthcare facilities, for example, may naturally experience more reactive work than office environments due to the critical nature of their equipment.
Improving Planned Maintenance Percentage often starts with reviewing recurring failures.
Look for assets that repeatedly generate reactive work orders and consider introducing scheduled inspections or preventive maintenance tasks to reduce future breakdowns.
Using CAFM software can also help automate preventive maintenance schedules, ensuring recurring work is generated before issues become costly failures.
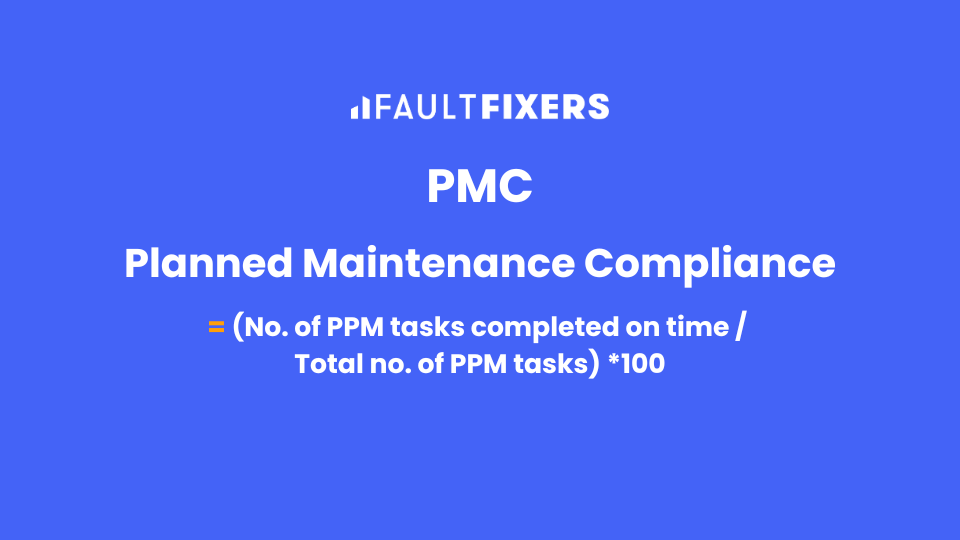
Preventive Maintenance (PM) Compliance measures how consistently your scheduled maintenance programme is being completed.
It's one thing to have a preventive maintenance schedule in place; it's another to ensure those inspections and servicing tasks are completed on time.
High PM compliance demonstrates that maintenance activities are being carried out as planned, reducing the likelihood of unexpected equipment failures and helping organisations remain compliant with statutory maintenance requirements.
(Completed Preventive Maintenance Tasks ÷ Scheduled Preventive Maintenance Tasks) × 100
Preventive maintenance only delivers value if it's completed consistently.
When planned inspections are delayed or missed, small issues can develop into major failures, leading to higher repair costs, increased downtime and unnecessary disruption.
For facilities managers responsible for regulated environments such as schools, healthcare facilities and care homes, poor PM compliance can also increase compliance risk during inspections or audits.
Maintaining a high compliance rate helps organisations:
Most organisations should aim for at least 95% PM compliance, although critical life safety assets may require 100% completion.
Rather than focusing solely on the overall percentage, review trends over time. Consistent improvement is often more valuable than achieving a single high-performing month.
Improving PM compliance usually comes down to planning and visibility.
Facilities managers should prioritise critical assets, ensure technicians have sufficient capacity, and automate recurring work wherever possible. CAFM software can generate preventive maintenance tasks automatically, notify technicians when work is due, and provide clear reporting on missed or overdue activities.
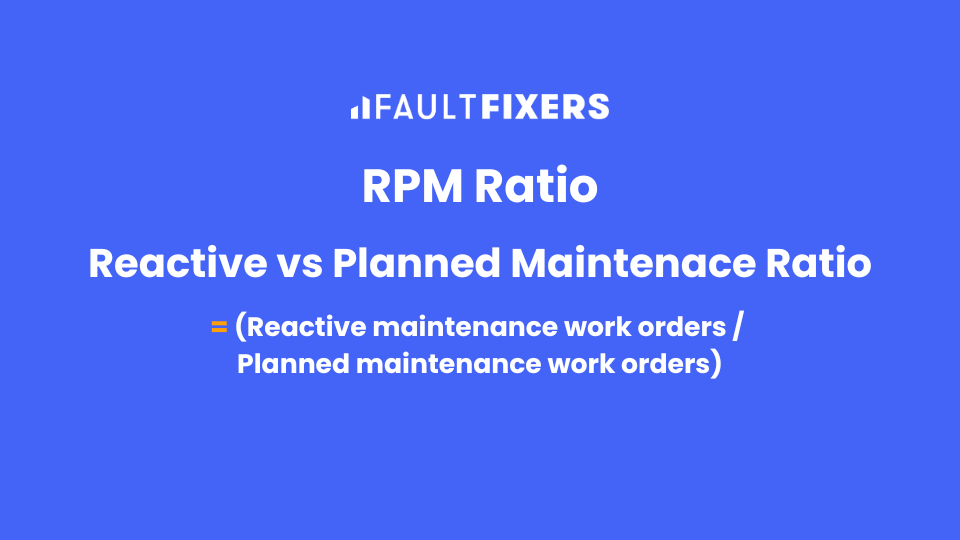
This KPI compares the amount of reactive maintenance carried out against planned maintenance.
Unlike Planned Maintenance Percentage, which measures the proportion of planned work, this KPI highlights the balance between preventing failures and responding to them.
A maintenance team overwhelmed by reactive work often has little time left for preventive activities, creating a cycle where breakdowns continue to increase.
One common way to express this is:
Reactive Maintenance Work Orders ÷ Planned Maintenance Work Orders
Many organisations also report this as a percentage split (for example, 75% planned and 25% reactive).
Reactive maintenance is unavoidable. Equipment will fail unexpectedly, emergencies will happen, and urgent repairs will always form part of a maintenance team's workload.
The goal isn't to eliminate reactive maintenance altogether, but to ensure it doesn't dominate the team's time.
A healthy balance typically results in:
If reactive work consistently increases month after month, it's often a sign that preventive maintenance schedules need reviewing or ageing assets require replacement.
While there isn't a universal target, many organisations aim for:
The appropriate balance will depend on the type of facility, the age of assets and operational priorities.
Reducing reactive maintenance starts with understanding why failures occur.
Review recurring work orders, identify assets with repeated breakdowns and carry out root cause analysis where possible. Increasing preventive maintenance on high-risk equipment can often reduce emergency work significantly over time.
Monitoring this ratio monthly also makes it easier to demonstrate improvements to senior management.

Mean Time Between Failures (MTBF) measures how long a repairable asset operates before experiencing another failure.
It is one of the most widely used indicators of asset reliability and helps facilities managers understand how effectively maintenance strategies are preventing breakdowns.
A higher MTBF generally indicates more reliable equipment.
Total Operating Time ÷ Number of Failures
For example, if a boiler operates for 4,000 hours over a year and experiences four failures, its MTBF would be 1,000 operating hours.
Note: MTBF is used for repairable assets. For components that are replaced rather than repaired, organisations often use Mean Time to Failure (MTTF) instead.
Improving MTBF means equipment is running for longer periods without interruption.
This leads to:
Tracking MTBF over time can also help identify when assets are approaching the end of their useful life, supporting more informed replacement decisions.
Unlike many maintenance KPIs, MTBF doesn't have a universal benchmark.
Acceptable values vary significantly depending on the asset being measured. A lift, HVAC system and fire alarm panel will all have very different expected operating lifespans and failure frequencies.
Instead of comparing different asset types, monitor MTBF for the same asset over time.
If MTBF is increasing, reliability is improving. If it's decreasing, further investigation is likely required.
Increasing MTBF is usually achieved through better preventive and predictive maintenance.
Facilities managers should:
Modern CAFM systems can make this process much easier by maintaining a complete service history for every asset, allowing teams to identify reliability trends and recurring issues much more quickly.
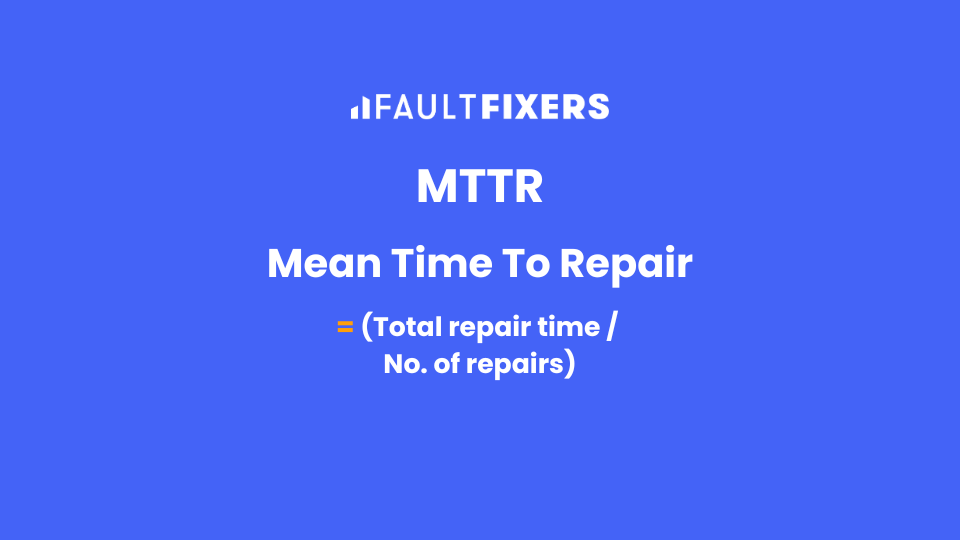
Mean Time to Repair (MTTR) measures the average time it takes to restore an asset to normal operation after a failure occurs.
Unlike Mean Time Between Failures (MTBF), which focuses on preventing breakdowns, MTTR measures how efficiently maintenance teams respond when failures happen.
The lower your MTTR, the faster equipment is returned to service.
Total Repair Time ÷ Number of Repairs
For example, if ten repairs take a combined total of 40 hours, your MTTR is four hours.
Every hour an important asset remains out of service can impact operations, increase costs and reduce productivity.
A low MTTR generally indicates that maintenance teams have:
Reducing repair time also helps minimise disruption for building occupants, residents, patients, students or staff.
There's no universal MTTR target because repair times vary significantly depending on the complexity of the asset.
Instead, use MTTR to measure improvement over time or compare similar assets within your estate.
For example, if the average repair time for HVAC units drops from six hours to four hours over twelve months, your maintenance operation is becoming more efficient.
Reducing MTTR often comes down to preparation.
Facilities managers can improve repair times by:
With a CAFM platform, technicians can view previous repairs, manuals, photos and notes directly from their mobile device, reducing time spent diagnosing issues.
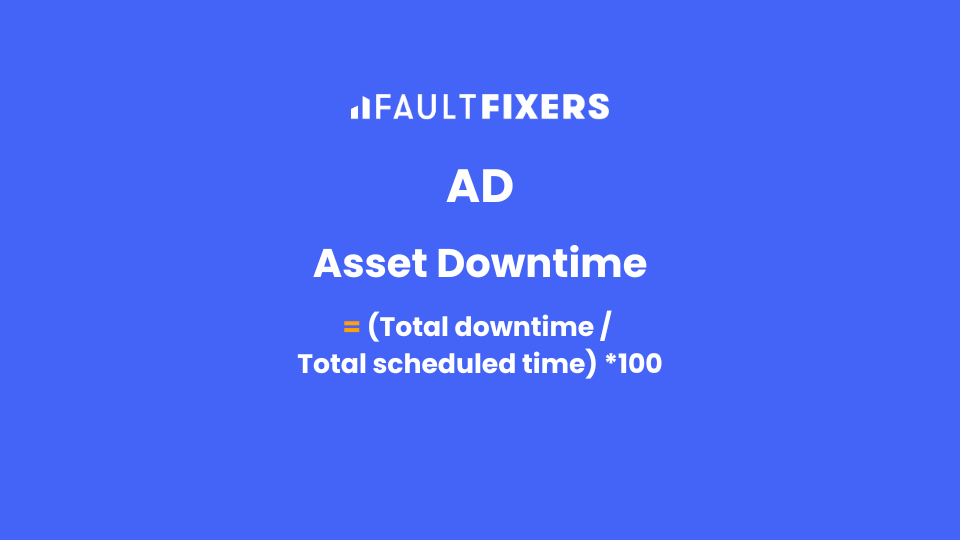
Asset Downtime measures how long equipment or facilities remain unavailable due to maintenance, breakdowns or failures.
Downtime can be measured for individual assets, buildings or entire sites, depending on the level of reporting required.
(Total Downtime / Total Scheduled Time) × 100
Some organisations also express downtime as a percentage of planned operating time.
Downtime is one of the clearest indicators of maintenance performance because it directly affects business operations.
The consequences of downtime often extend far beyond the maintenance team.
Examples include:
Monitoring downtime helps facilities managers identify which assets have the greatest operational impact and where maintenance investment will deliver the highest return.
Rather than comparing downtime against industry averages, focus on reducing downtime for your most critical assets year after year.
Some downtime is planned for servicing and inspections. The objective is to minimise unexpected downtime while ensuring essential maintenance still takes place.
Reducing downtime requires a proactive maintenance strategy.
Facilities managers should:
Tracking downtime alongside MTBF and MTTR provides a much clearer picture of overall asset performance than monitoring any single KPI in isolation.

Work Order Completion Rate measures how successfully maintenance teams complete the work assigned to them during a reporting period.
It provides an overall indication of maintenance capacity, operational efficiency and workload management.
(Completed Work Orders ÷ Total Work Orders Due During the Reporting Period) × 100
Some organisations calculate this using all work orders created during the period. Whichever method you choose, use the same calculation consistently so results remain comparable over time.
A consistently low completion rate may indicate:
A high completion rate suggests work is being planned effectively and technicians have the resources needed to complete jobs on time.
However, this KPI should always be viewed alongside work quality. Completing more jobs means little if repairs require repeat visits or problems quickly return.
Many organisations aim for a completion rate of 90% or higher, although this varies depending on workload and operational priorities.
The trend is often more important than the exact percentage.
Improving work order completion often involves refining processes rather than simply increasing workload.
Facilities managers can improve completion rates by:
Real-time dashboards also make it easier to identify overdue work before backlogs begin to build.
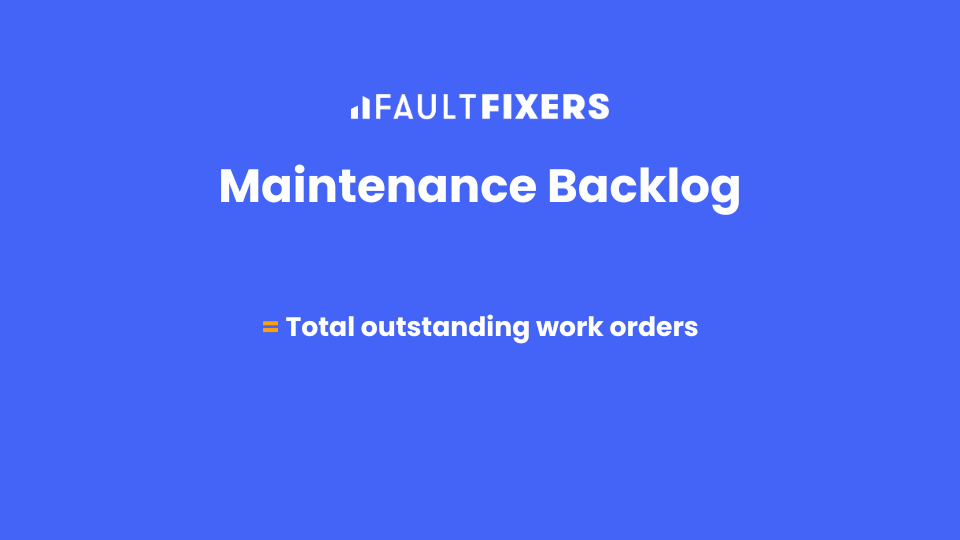
Maintenance Backlog represents the amount of outstanding maintenance work that has not yet been completed.
While some backlog is expected in every organisation, a continually growing backlog often indicates that maintenance demand is exceeding available resources.
There isn't a single industry-standard formula.
Backlog is commonly measured as:
Total Outstanding Work Orders
or
Outstanding Labour Hours Required to Complete All Open Work
Measuring backlog in labour hours often provides a more accurate picture of maintenance workload because not all work orders require the same amount of effort.
A growing maintenance backlog can lead to:
Reviewing backlog by priority is particularly important.
A backlog of low-priority cosmetic repairs is very different from a backlog of overdue compliance inspections or critical plant maintenance.
Facilities managers should regularly analyse backlog by:
This helps identify bottlenecks and allocate resources more effectively.
Rather than aiming for zero backlog, organisations should focus on maintaining a manageable and stable workload.
Critical maintenance should be completed promptly, while lower-priority work can often be scheduled over longer timeframes.
Monitoring backlog trends month by month is generally more valuable than focusing on a single reporting period.
Reducing backlog starts with understanding why work is accumulating.
Common improvements include:
A CAFM system can provide real-time visibility into outstanding work, allowing facilities managers to identify overdue jobs, rebalance workloads and prevent backlogs from escalating.
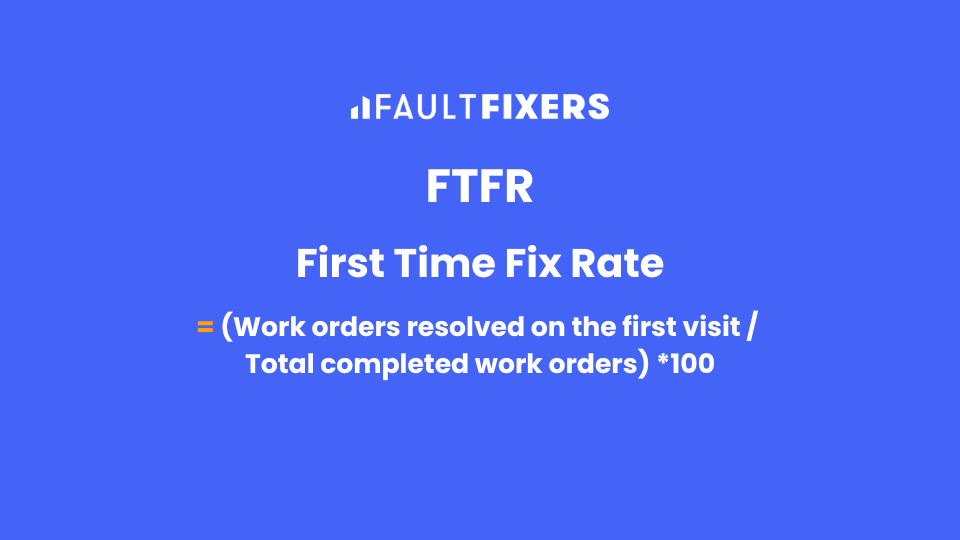
First-Time Fix Rate (FTFR) measures the percentage of maintenance jobs that are successfully resolved during the first visit, without requiring follow-up work.
Rather than simply measuring how many jobs are completed, FTFR measures how effectively they're completed.
(Work Orders Resolved on the First Visit ÷ Total Completed Work Orders) × 100
Every repeat visit increases labour costs, delays resolution and reduces technician availability.
A high First-Time Fix Rate usually indicates that technicians have:
Improving FTFR can have a significant impact on maintenance efficiency, particularly for organisations managing multiple buildings or dispersed sites.
For occupants, it also means issues are resolved faster with less disruption.
Many organisations target a First-Time Fix Rate between 85% and 95%, although this varies depending on the complexity of the work being carried out.
Emergency repairs or specialist assets may naturally require additional visits.
Improving FTFR starts before the technician arrives on site.
Facilities managers should ensure work orders include sufficient information, such as:
Providing technicians with mobile access to asset records and maintenance history can significantly reduce repeat visits by helping them diagnose problems more accurately during the first attendance.

Maintenance Cost per Square Foot measures the amount spent maintaining a facility relative to its size.
It's one of the most widely used facilities management KPIs because it allows organisations to compare maintenance costs across different buildings, campuses or property portfolios.
Total Maintenance Costs ÷ Total Floor Area
Maintenance costs typically include:
Looking at total maintenance spend alone doesn't provide much context.
For example, spending £250,000 per year on maintenance may seem high until it's compared against the size and complexity of the estate being managed.
Maintenance Cost per Square Foot allows facilities managers to:
It's particularly valuable for organisations managing multiple sites, such as schools, care home groups, healthcare providers and commercial property portfolios.
Maintenance costs vary considerably depending on building type, age, occupancy and the complexity of installed assets.
Rather than comparing your buildings with national averages, it's often more valuable to compare similar facilities within your own portfolio and monitor improvements over time.
Reducing maintenance costs shouldn't mean reducing maintenance quality.
Instead, facilities managers should focus on:
The goal is to achieve lower long-term maintenance costs while maintaining or improving service levels.
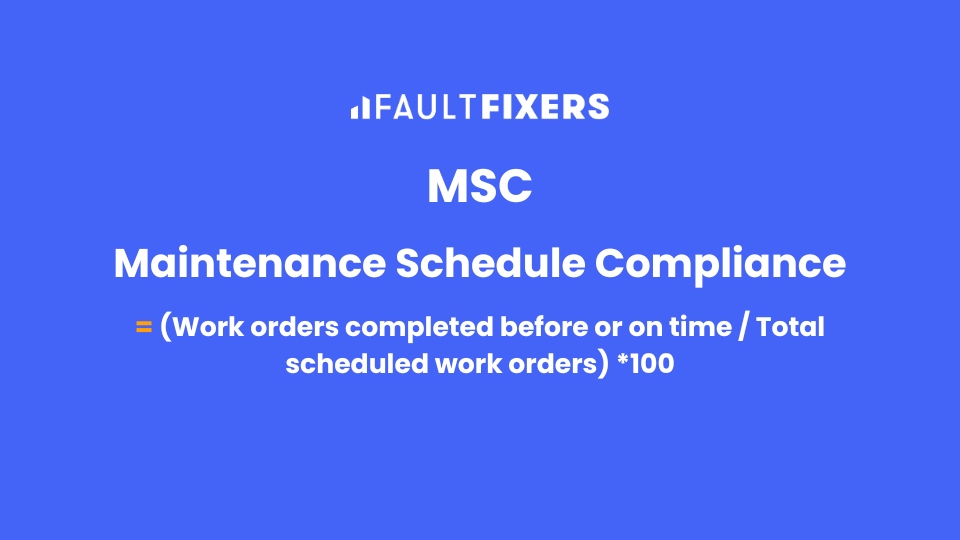
Maintenance Schedule Compliance measures whether planned maintenance work is completed when it was originally scheduled.
While Preventive Maintenance Compliance focuses on whether maintenance tasks are eventually completed, Schedule Compliance focuses on completing them on time.
This distinction is important because delaying planned maintenance can still increase operational risk, even if the work is completed later.
(Scheduled Work Orders Completed On or Before Their Due Date ÷ Total Scheduled Work Orders) × 100
Poor schedule compliance can create a domino effect across the maintenance operation.
Delayed work often results in:
Monitoring schedule compliance helps facilities managers understand whether maintenance plans are realistic and whether sufficient resources are available to deliver them.
Many organisations aim for 90–95% schedule compliance, particularly for preventive maintenance programmes.
Critical compliance inspections and statutory maintenance should ideally achieve close to 100%.
Improving schedule compliance often requires better planning rather than additional resources.
Facilities managers should:
Using CAFM software to automatically schedule recurring maintenance and notify technicians when work becomes due can significantly improve compliance without increasing administrative effort.
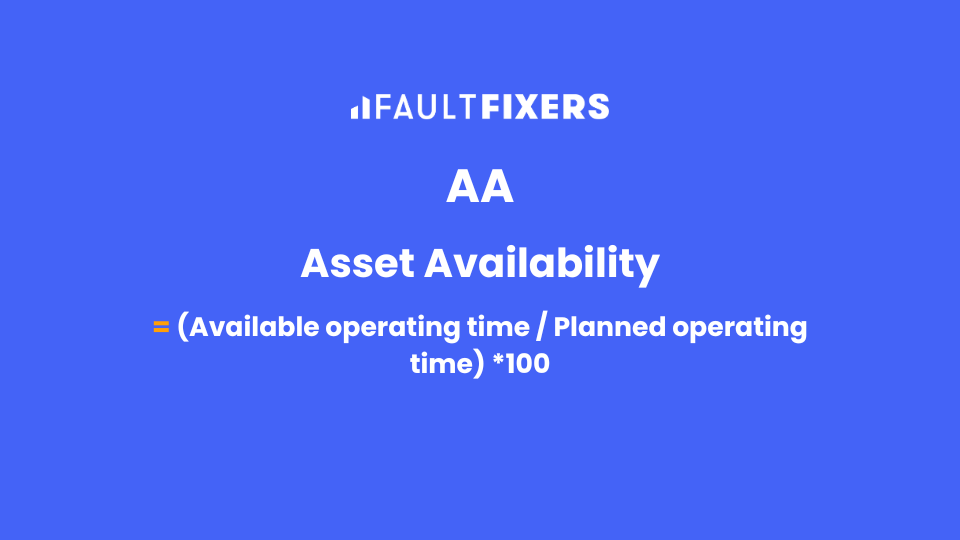
Asset Availability measures the percentage of time an asset is available for use when it's expected to be operational.
Ultimately, maintenance exists to keep assets available, reliable and safe.
For many organisations, this is the KPI that matters most because it reflects the outcome of every maintenance activity.
(Available Operating Time ÷ Planned Operating Time) × 100
High asset availability means equipment is ready when it's needed.
Whether it's a passenger lift in a care home, an air handling unit in a hospital, heating in a school or essential building services in a commercial office, reliable assets reduce disruption and improve the experience of building occupants.
Improving availability can lead to:
Asset Availability also brings together many of the KPIs discussed throughout this guide.
If Planned Maintenance Percentage increases, MTBF improves, MTTR decreases and preventive maintenance is completed on time, asset availability should naturally improve as well.
Target availability depends on the criticality of the asset.
Business-critical systems often aim for 99% availability or higher, while less critical assets may have lower acceptable thresholds.
Rather than applying a single target across every asset, organisations should categorise equipment by criticality and set performance expectations accordingly.
Improving asset availability requires a balanced maintenance strategy.
Facilities managers should focus on:
Over time, improvements across multiple maintenance KPIs should translate into greater asset availability and a more resilient estate.
While every organisation will have different priorities, the table below provides a useful starting point for benchmarking maintenance performance.
Remember: These benchmarks are intended as general guidance. The right targets for your organisation will depend on your industry, the age of your assets, operational priorities and available resources. Consistently improving your own performance over time is often more valuable than comparing yourself with generic industry averages.
One of the biggest benefits of monitoring facilities maintenance metrics is being able to show the return on investment in something like facilities management software. If you have have invested in software you may also have access to a maintenance KPI dashboard that you can use to visualise these metrics and share them internally.
The standard ROI formula is: (profit - cost) / cost. For facility maintenance, the majority of the cost is in labour, so the number of hours it takes to complete the maintenance.
For most facility management teams, the profit is often not something that is directly related to an improvement in maintenance management. But, I think everybody knows using common sense that an improvement in a facility like a gym, school or care home will have a direct impact on the customers experience and therefore revenue generated or memberships and tenancy rates.
Facility maintenance is a key component of a businesses success. Maintenance metrics should never be evaluated in isolation, they should be monitored alongside business metrics that are associated with a better facility. For facilities these types of metrics can include:
Alongside these metrics some more qualitative analysis is often required when assessing the impact of facility maintenance on wider business operations. This means getting more subjective data on the facility such as reviews and opinions expressed by the users of the facilities. A badly maintained facility can have a big impact on business. Just look at this Google review below:

This is where facilities management differs from manufacturing maintenance management. A manufacturing facility typically only has employees as tenants and users, they are not customers. A facility like a gym, swimming pool, football stadium on the other hand are judged based on their facilities and a negative review, opinion or experience can directly impact the businesses success. Facility maintenance metrics can not only help you measure and improve your facility management operations, it can help improve your companies reputation and revenue.
Tracking maintenance KPIs is only valuable if the data is used to drive better decisions. Many organisations collect vast amounts of maintenance data but struggle to turn it into meaningful action.
Here are some of the most common mistakes facilities managers should avoid.
It's easy to become overwhelmed by data.
While modern CAFM systems can report on dozens of different metrics, not every KPI will be relevant to your organisation. Trying to monitor everything often makes it harder to identify what actually needs attention.
Instead, focus on a core set of KPIs that align with your maintenance objectives. For many facilities teams, these will include Planned Maintenance Percentage, Preventive Maintenance Compliance, MTTR, MTBF, Asset Availability and Work Order Completion Rate.
Review additional metrics only where they support a specific business goal.
A single month's performance rarely tells the whole story.
Unexpected weather, contractor availability, capital projects or emergency repairs can all influence maintenance metrics over a short period.
Rather than reacting to every fluctuation, monitor KPIs over several months to identify long-term trends.
For example:
Trend analysis provides far more meaningful insight than isolated snapshots.
Completing more work orders doesn't automatically mean maintenance performance has improved.
A team might complete hundreds of jobs each month while still experiencing increasing downtime or rising maintenance costs.
The best KPIs focus on outcomes rather than activity.
Ask questions such as:
These metrics provide a better indication of maintenance success than simply measuring workload.
Not every asset has the same operational impact.
A faulty light fitting and a failed fire alarm should never be treated equally within maintenance reporting.
Segmenting KPIs by asset criticality helps facilities managers prioritise resources where they deliver the greatest operational value.
For example, you may expect:
This creates more meaningful reporting and supports better decision-making.
Maintenance performance should be monitored regularly.
Waiting until the end of the year to review maintenance data often means opportunities for improvement have already been missed.
Many organisations benefit from:
Regular reporting allows maintenance teams to identify issues early and make continuous improvements throughout the year.
Tracking maintenance KPIs manually using spreadsheets can quickly become time-consuming, particularly for organisations managing multiple buildings, hundreds of assets or large maintenance teams.
Every work order, inspection, repair and asset update generates valuable information. The challenge is bringing that data together into meaningful reports without creating additional administrative work.
This is where CAFM software can make a significant difference.
Instead of manually collecting information from multiple systems, a CAFM platform automatically records maintenance activity as work is completed, giving facilities managers access to accurate, real-time performance data.
With FaultFixers, maintenance teams can:
Because reporting is automated, facilities managers spend less time building spreadsheets and more time making informed maintenance decisions.
Whether you're managing a single facility or a multi-site property portfolio, having instant visibility into maintenance performance makes it easier to identify opportunities for improvement and demonstrate the value of your maintenance team.
The best maintenance teams don't rely on instinct alone. They use data to understand what's happening across their estate, identify opportunities for improvement and make informed decisions about where to invest their time and budget.
Tracking maintenance KPIs isn't about creating more reports. It's about understanding whether your maintenance strategy is delivering the outcomes your organisation needs.
By regularly monitoring metrics such as Planned Maintenance Percentage, Preventive Maintenance Compliance, MTTR, MTBF and Asset Availability, facilities managers can reduce downtime, improve asset reliability and shift their teams from reactive firefighting to proactive maintenance planning.
Start with a small number of meaningful KPIs, review them consistently and use the insights they provide to drive continuous improvement.
Over time, those small improvements can have a significant impact on maintenance costs, operational efficiency and the long-term performance of your assets.
Maintenance KPIs (Key Performance Indicators) are measurable metrics used to evaluate the effectiveness, efficiency and reliability of maintenance operations. They help facilities managers understand how well assets are performing, identify areas for improvement and make data-driven decisions.
There isn't a single KPI that's most important for every organisation. The right metrics depend on your maintenance strategy, asset types and operational goals.
However, Planned Maintenance Percentage, Preventive Maintenance Compliance, Mean Time Between Failures (MTBF), Mean Time to Repair (MTTR) and Asset Availability are widely recognised as some of the most valuable indicators of maintenance performance.
MTBF measures the average operating time between equipment failures, making it a measure of asset reliability.
MTTR measures the average time taken to repair equipment after a failure has occurred, making it a measure of maintenance efficiency.
Together, these KPIs provide a balanced view of how often equipment fails and how quickly maintenance teams restore it to service.
Critical operational metrics such as downtime, emergency work orders and overdue maintenance should be monitored continuously or reviewed weekly.
Most maintenance teams produce formal KPI reports on a monthly basis, while quarterly reviews are useful for analysing long-term trends and identifying opportunities for improvement.
Yes. Most modern CAFM and CMMS platforms automatically collect maintenance data as work is completed.
This allows facilities managers to generate reports, monitor live dashboards and analyse maintenance performance without relying on manual spreadsheets.
While the terms are often used interchangeably, a CMMS (Computerised Maintenance Management System) focuses primarily on managing maintenance activities such as work orders, preventive maintenance and asset records.
A CAFM (Computer-Aided Facilities Management) system typically includes these maintenance capabilities while also supporting broader facilities management functions such as space management, compliance, contractor management and reporting.
Quality is more important than quantity.
Most organisations benefit from regularly monitoring 8 to 12 core maintenance KPIs that align with their operational objectives. Tracking too many metrics can make reporting more complex without providing additional value.
Focus on KPIs that help you improve decision-making, reduce downtime and measure progress over time.
FaultFixers gives facilities teams complete visibility over maintenance performance through real-time dashboards, automated reporting, asset histories and preventive maintenance tracking. Whether you're managing a single building or a complex multi-site estate, you'll have the insights needed to reduce downtime, improve asset reliability and make more informed maintenance decisions.
Book a free demo to see how FaultFixers can help you track the maintenance KPIs that matter most.